status
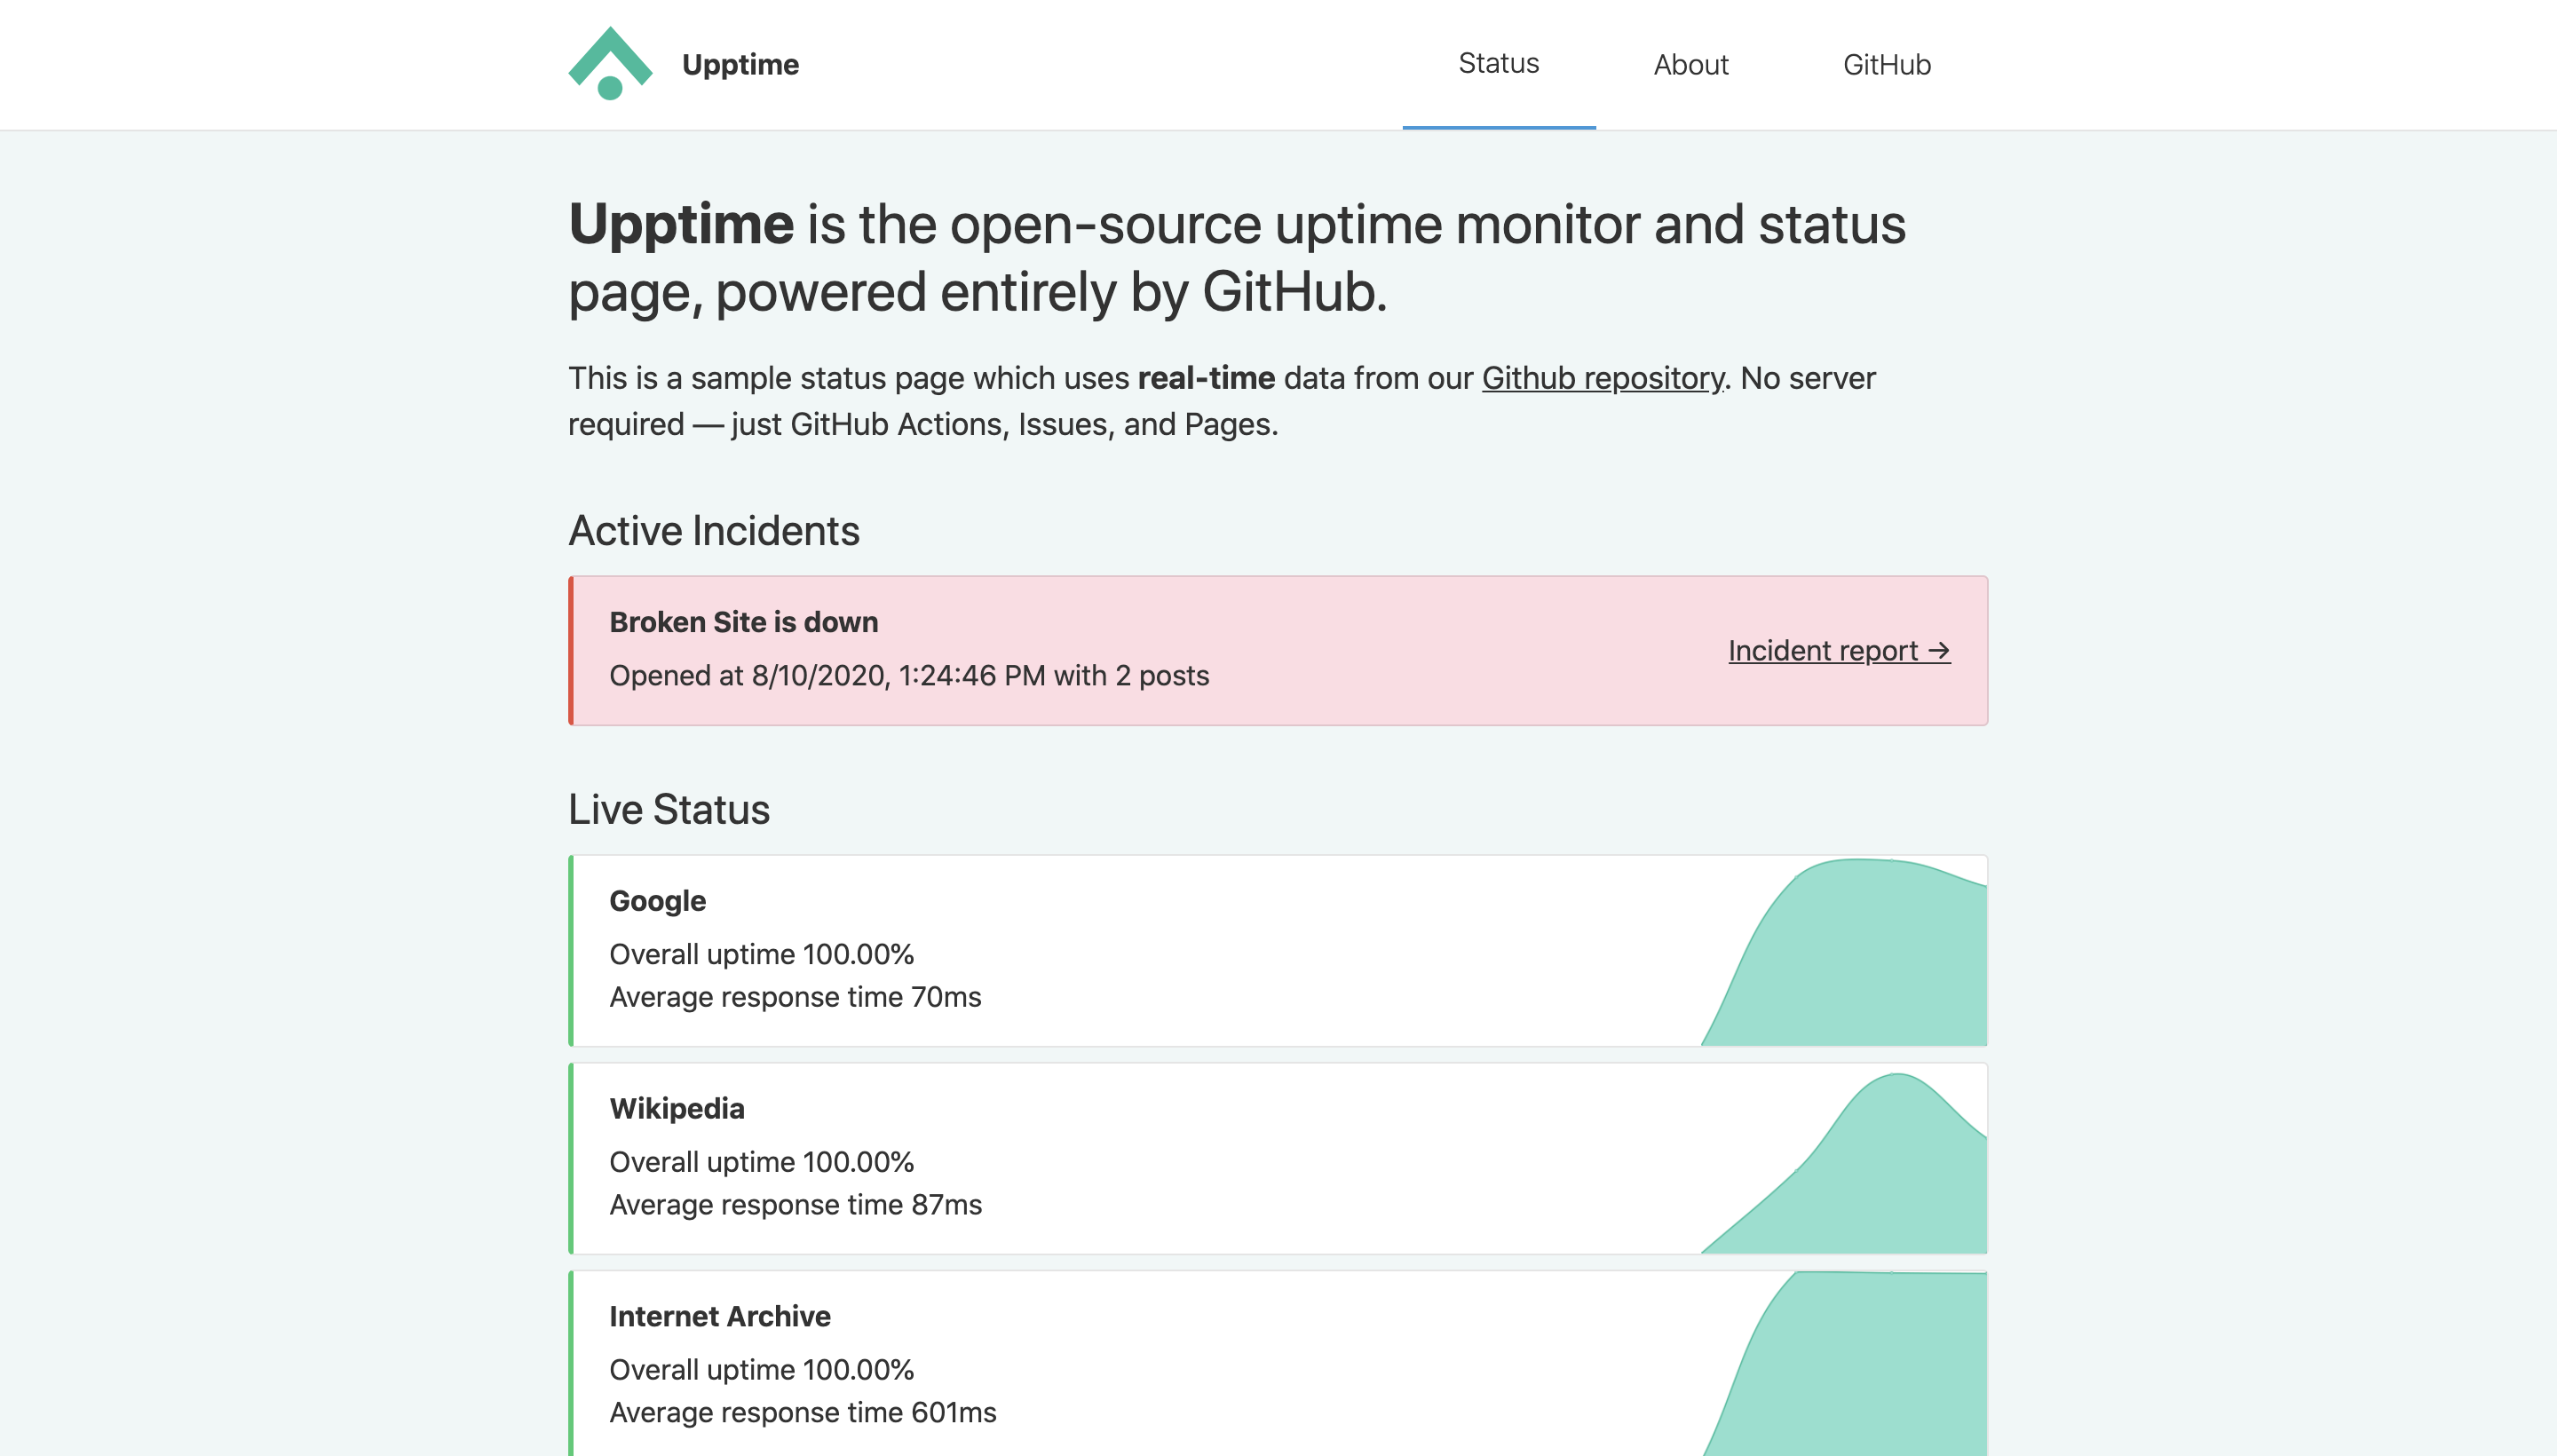
Upptime (https://upptime.js.org) is the open-source uptime monitor and status page, powered entirely by GitHub Actions, Issues, and Pages. It’s made with 💚 by Anand Chowdhary, supported by Pabio.
I find Upptime an incredible clever usage of [GitHub Actions]. You essentially get a free configurable uptime monitor for whatever you want. – CSS Tricks
Upptime is used by 3,000+ people and teams to ensure they know when their endpoints go down.
I built Upptime because, like many developers, I needed an uptime monitor and status page for my startup Pabio that was affordable, flexible, and completely under my control. At the time, existing services felt expensive, rigid, or closed-source. GitHub Actions had just launched, and I thought: hmm... what if I turned Actions into a self-hosted uptime monitor? Upptime runs scheduled checks using GitHub Actions (as often as every 5 minutes) to ping your endpoints and verify they're online. Response time data is recorded and committed to git, enabling long-term trend charts and historical insights. When downtime is detected, GitHub Issues are automatically opened and closed. A status page built with Svelte is hosted via GitHub Pages and shows uptime, response times, and incident history - so you get the full-stack uptime monitor and status page. I built it to be completely free if you're already using GitHub since there's no external server or subscription needed. All configuration lives in a single file, and your data is gone if you delete the repo. Plus, you get a git-native audit trail for all changes and events. Since launching, Upptime has grown to over 16,000 stars and is actively used by developers and teams to monitor their services. In fact, Upptime is used by [over 3,000+ people and teams](https://github.com/topics/upptime), including Ubuntu-maker Canonical and my preferred developer time tracker Wakatime.![]()
![]()
![]()
![]()
![]()
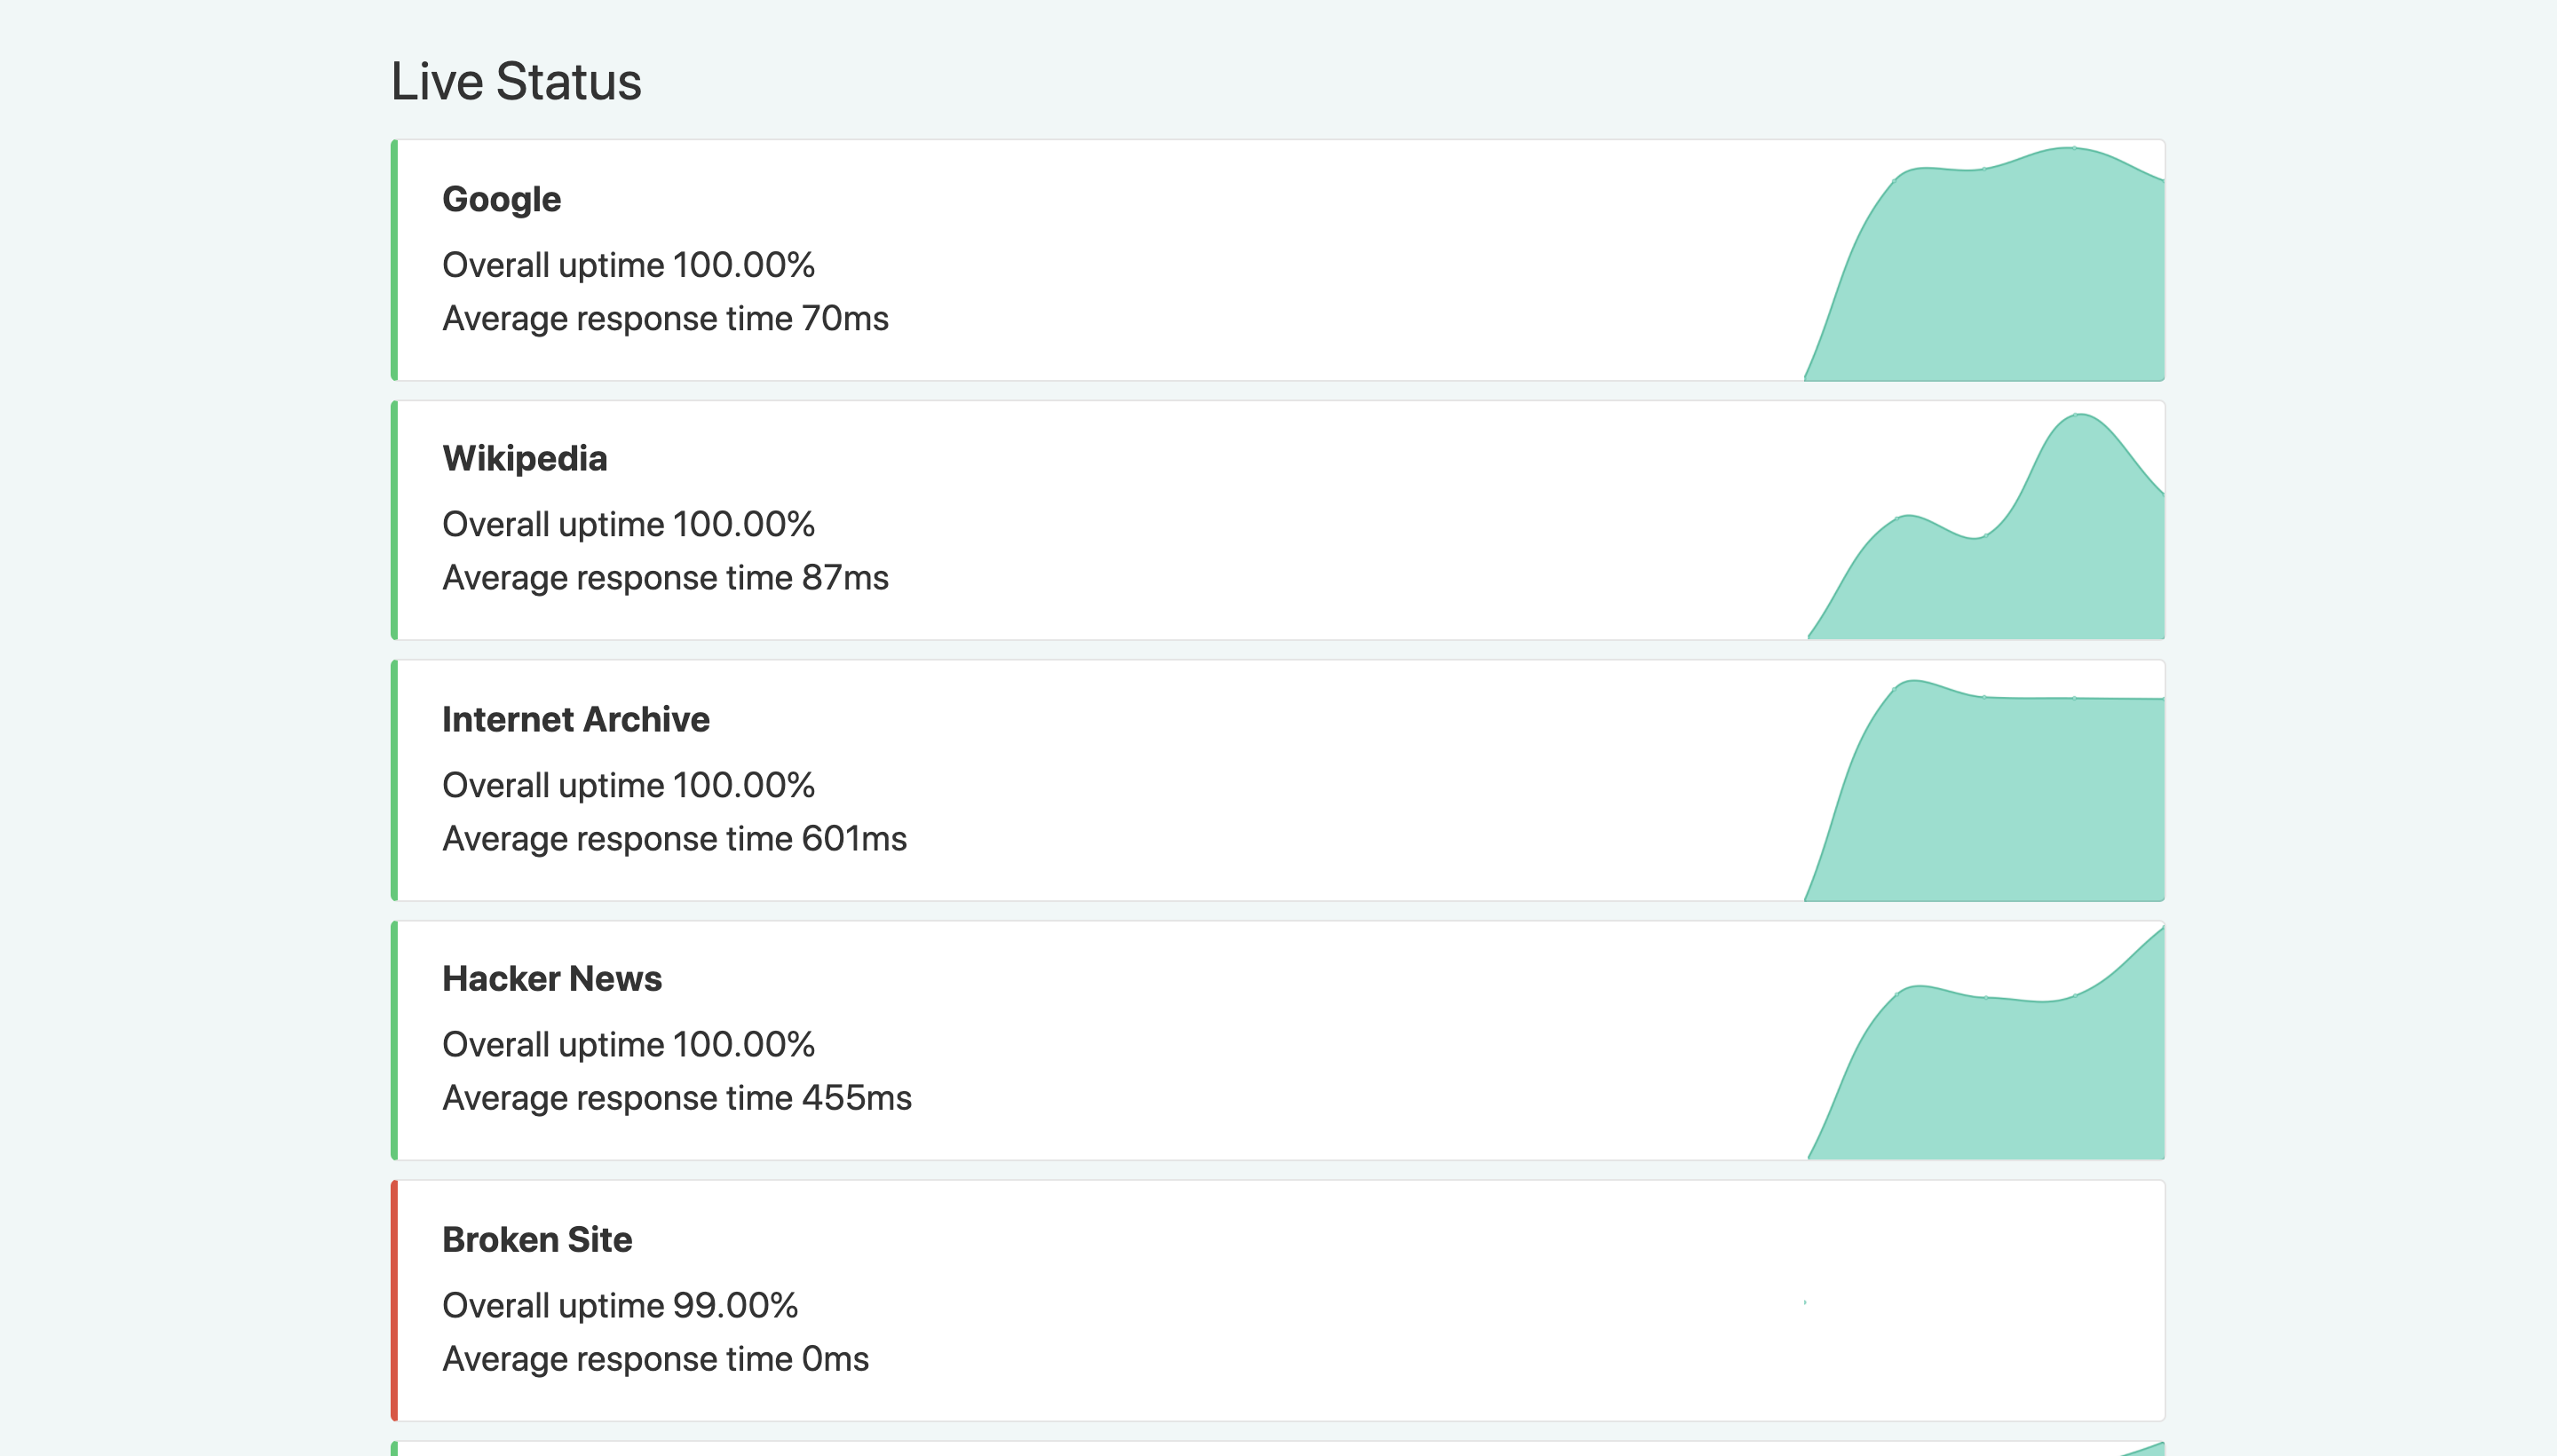
📈 Live Status: 🟧 Partial outage
| URL | Status | History | Response Time | Uptime |
| — | —— | ——- | ————- | —— |
| Google | 🟩 Up | google.yml |
![]() 95ms</summary>
95ms</summary> Wikipedia | 🟩 Up | wikipedia.yml |
![]() 148ms</summary>
148ms</summary> Hacker News | 🟩 Up | hacker-news.yml |
![]() 287ms</summary>
287ms</summary> Test Broken Site | 🟥 Down | test-broken-site.yml |
![]() 0ms</summary>
0ms</summary>


⭐ How it works
- GitHub Actions is used as an uptime monitor
- Every 5 minutes, a workflow visits your website to make sure it’s up
- Response time is recorded every 6 hours and committed to git
- Graphs of response time are generated every day
- GitHub Issues is used for incident reports
- An issue is opened if an endpoint is down
- People from your team are assigned to the issue
- Incidents reports are posted as issue comments
- Issues are locked so non-members cannot comment on them
- Issues are closed automatically when your site comes back up
- Slack notifications are sent on updates
- GitHub Pages is used for the status website
- A simple, beautiful, and accessible PWA is generated
- Built with Svelte and Sapper
- Fetches data from this repository using the GitHub API
Upptime is not affiliated to or endorsed by GitHub.
👩💻 Documentation
- How it works
- Getting started
- Configuration
- Triggers
- Notifications
- Badges
- Packages
- Contributing
- Frequently Asked Questions
Concepts
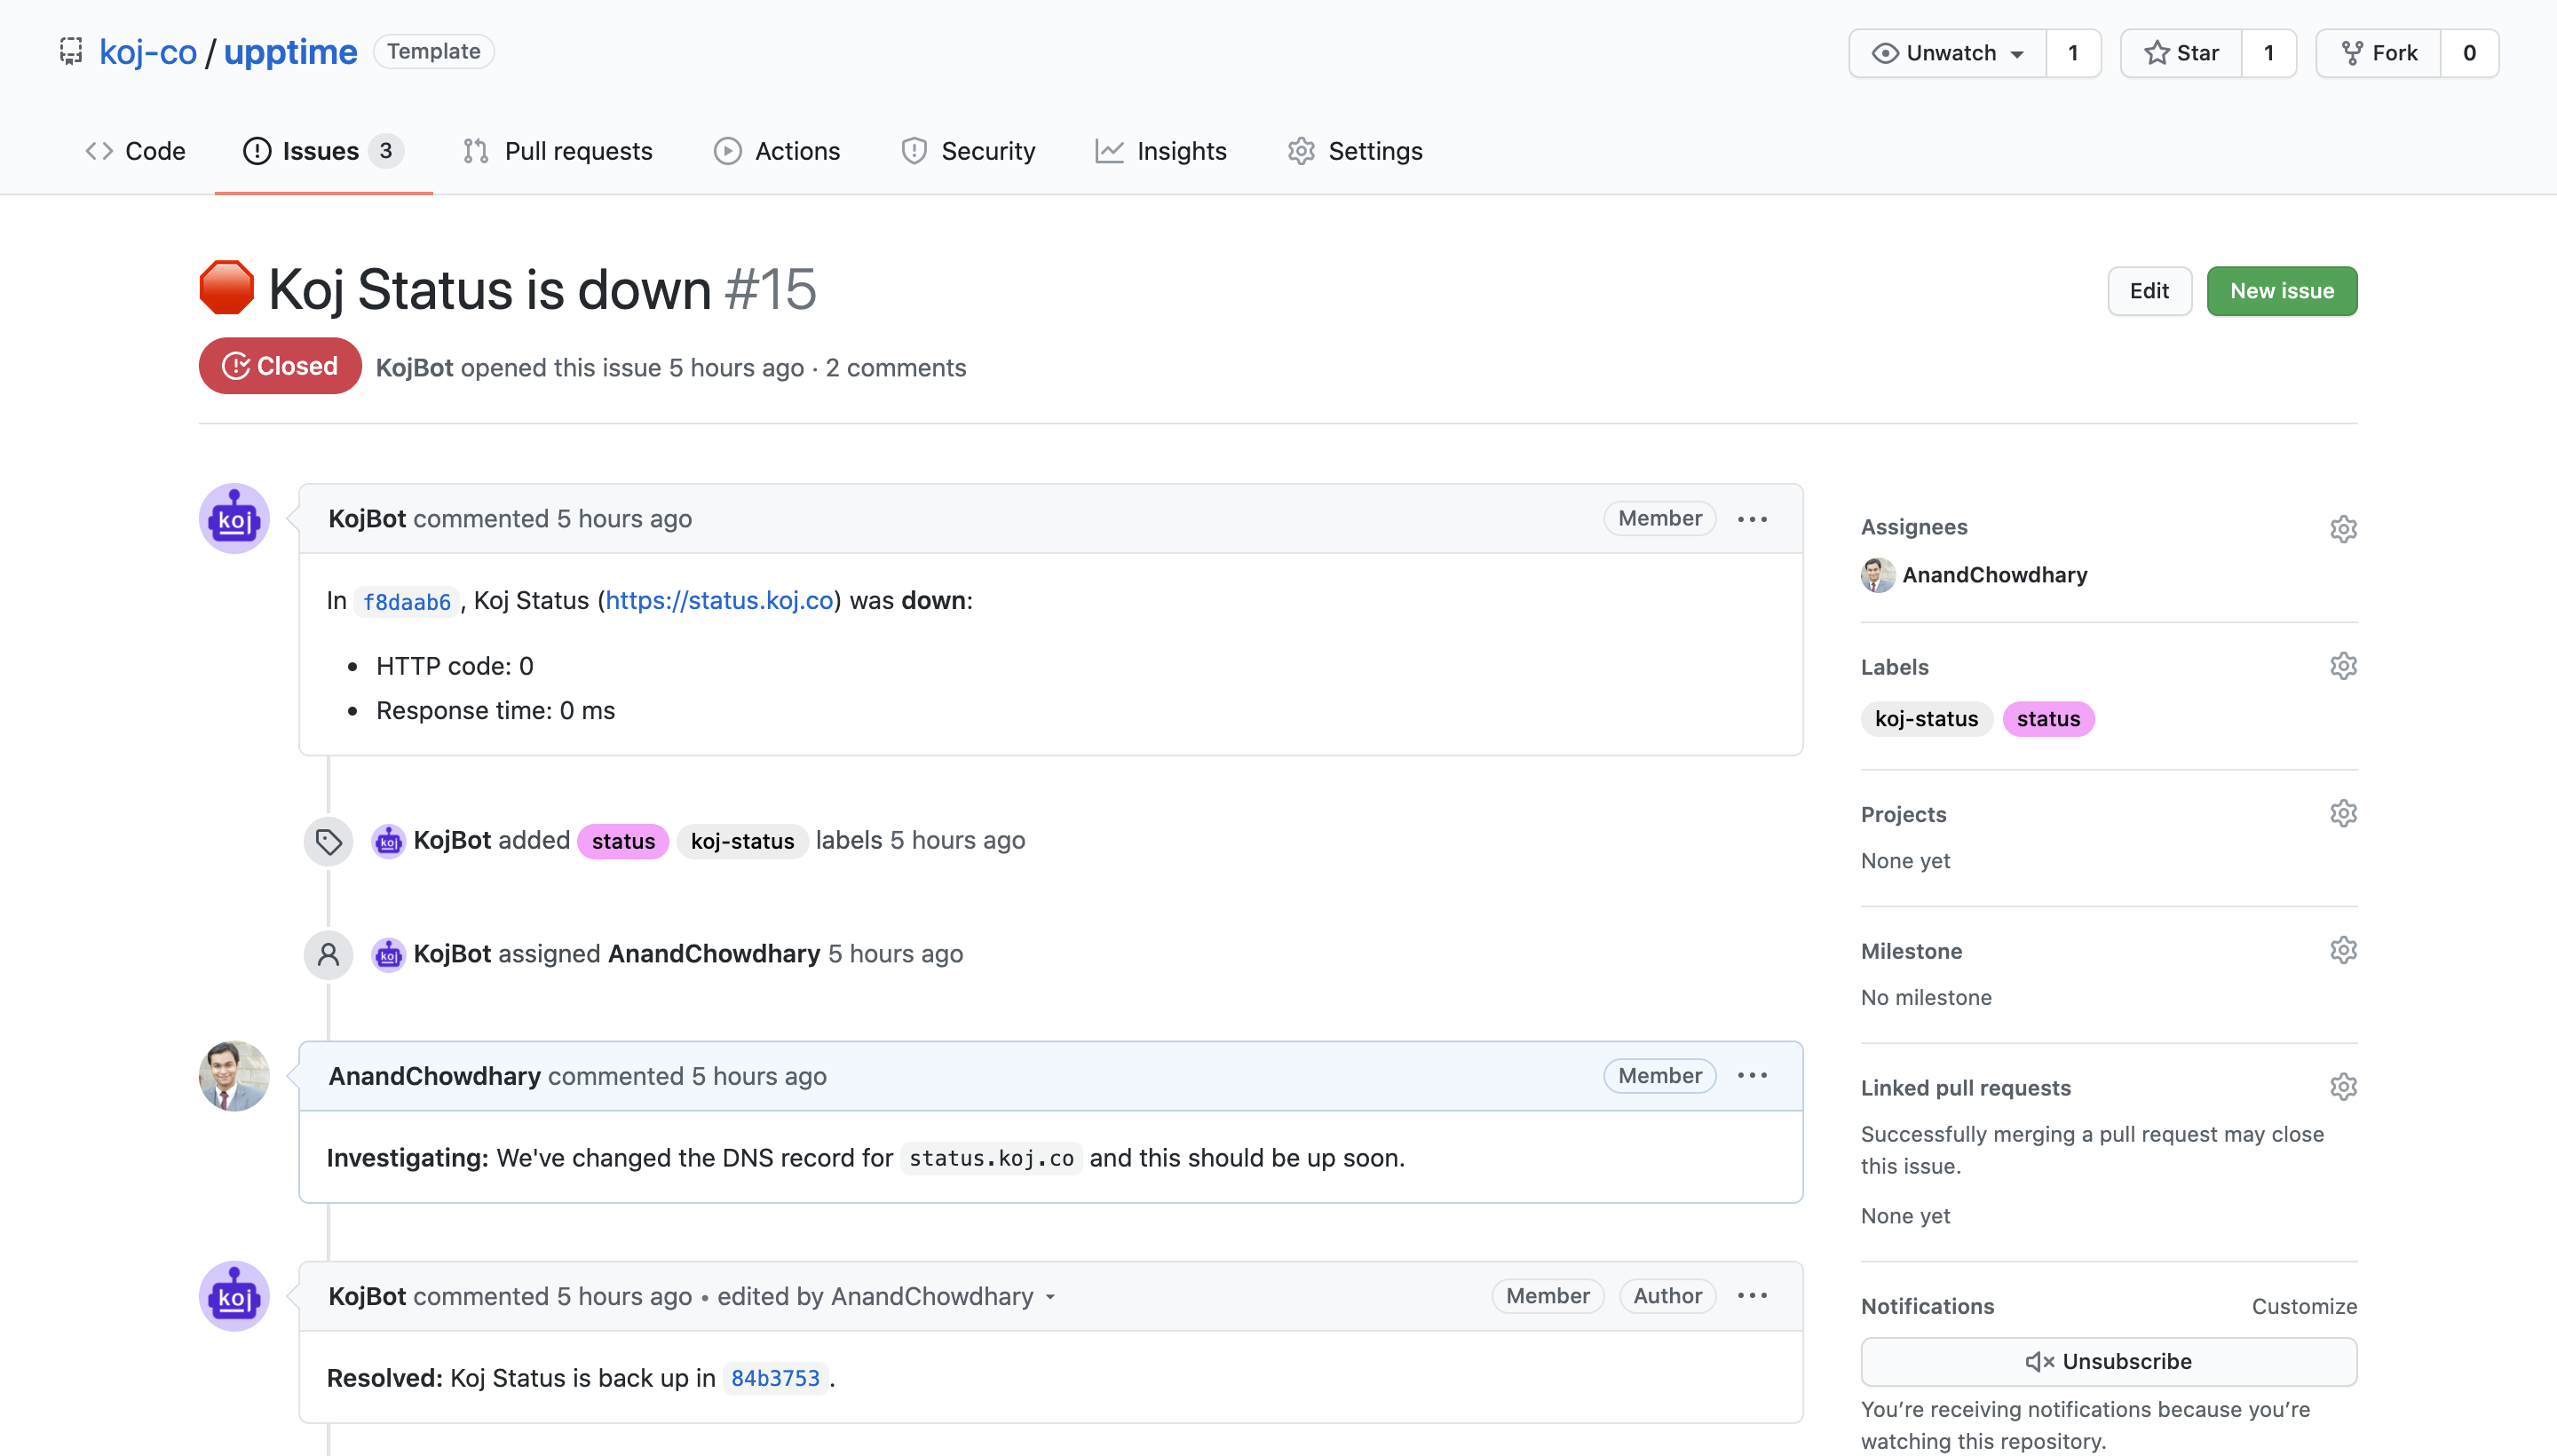
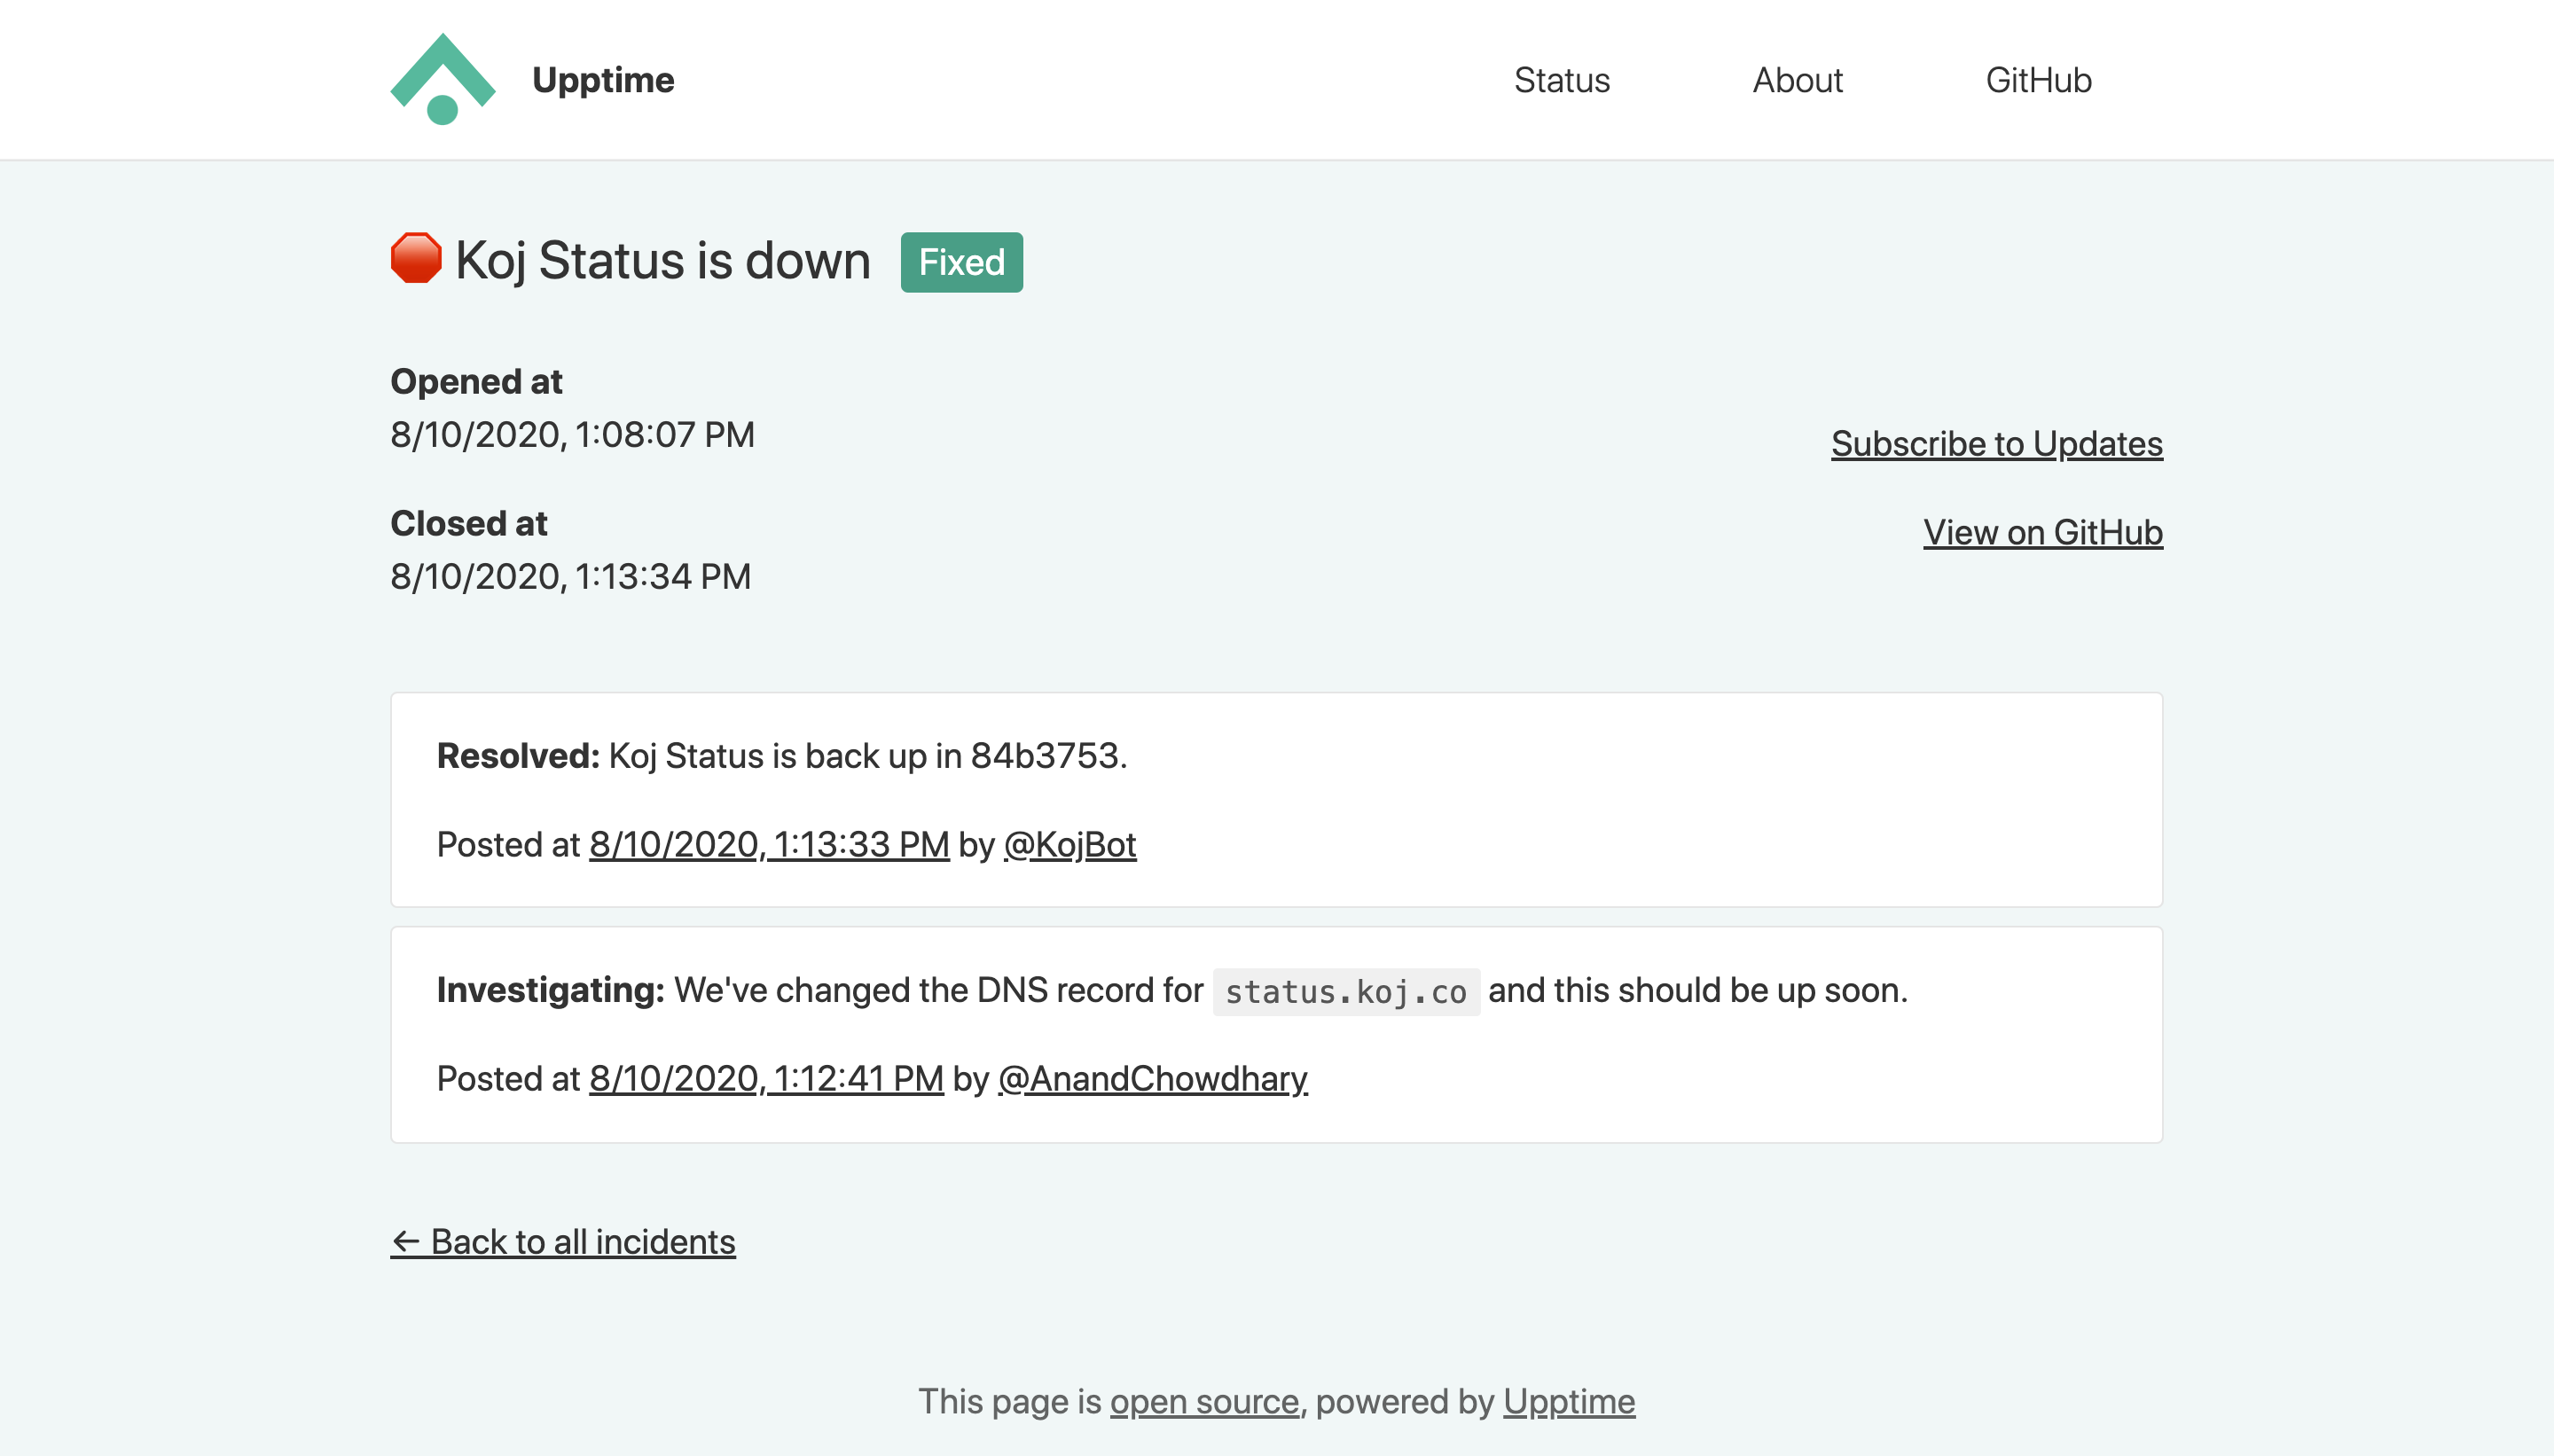
Issues as incidents
When the GitHub Actions workflow detects that one of your URLs is down, it automatically opens a GitHub issue (example issue #67). You can add incident reports to this issue by adding comments. When your site comes back up, the issue will be closed automatically as well.
|
|
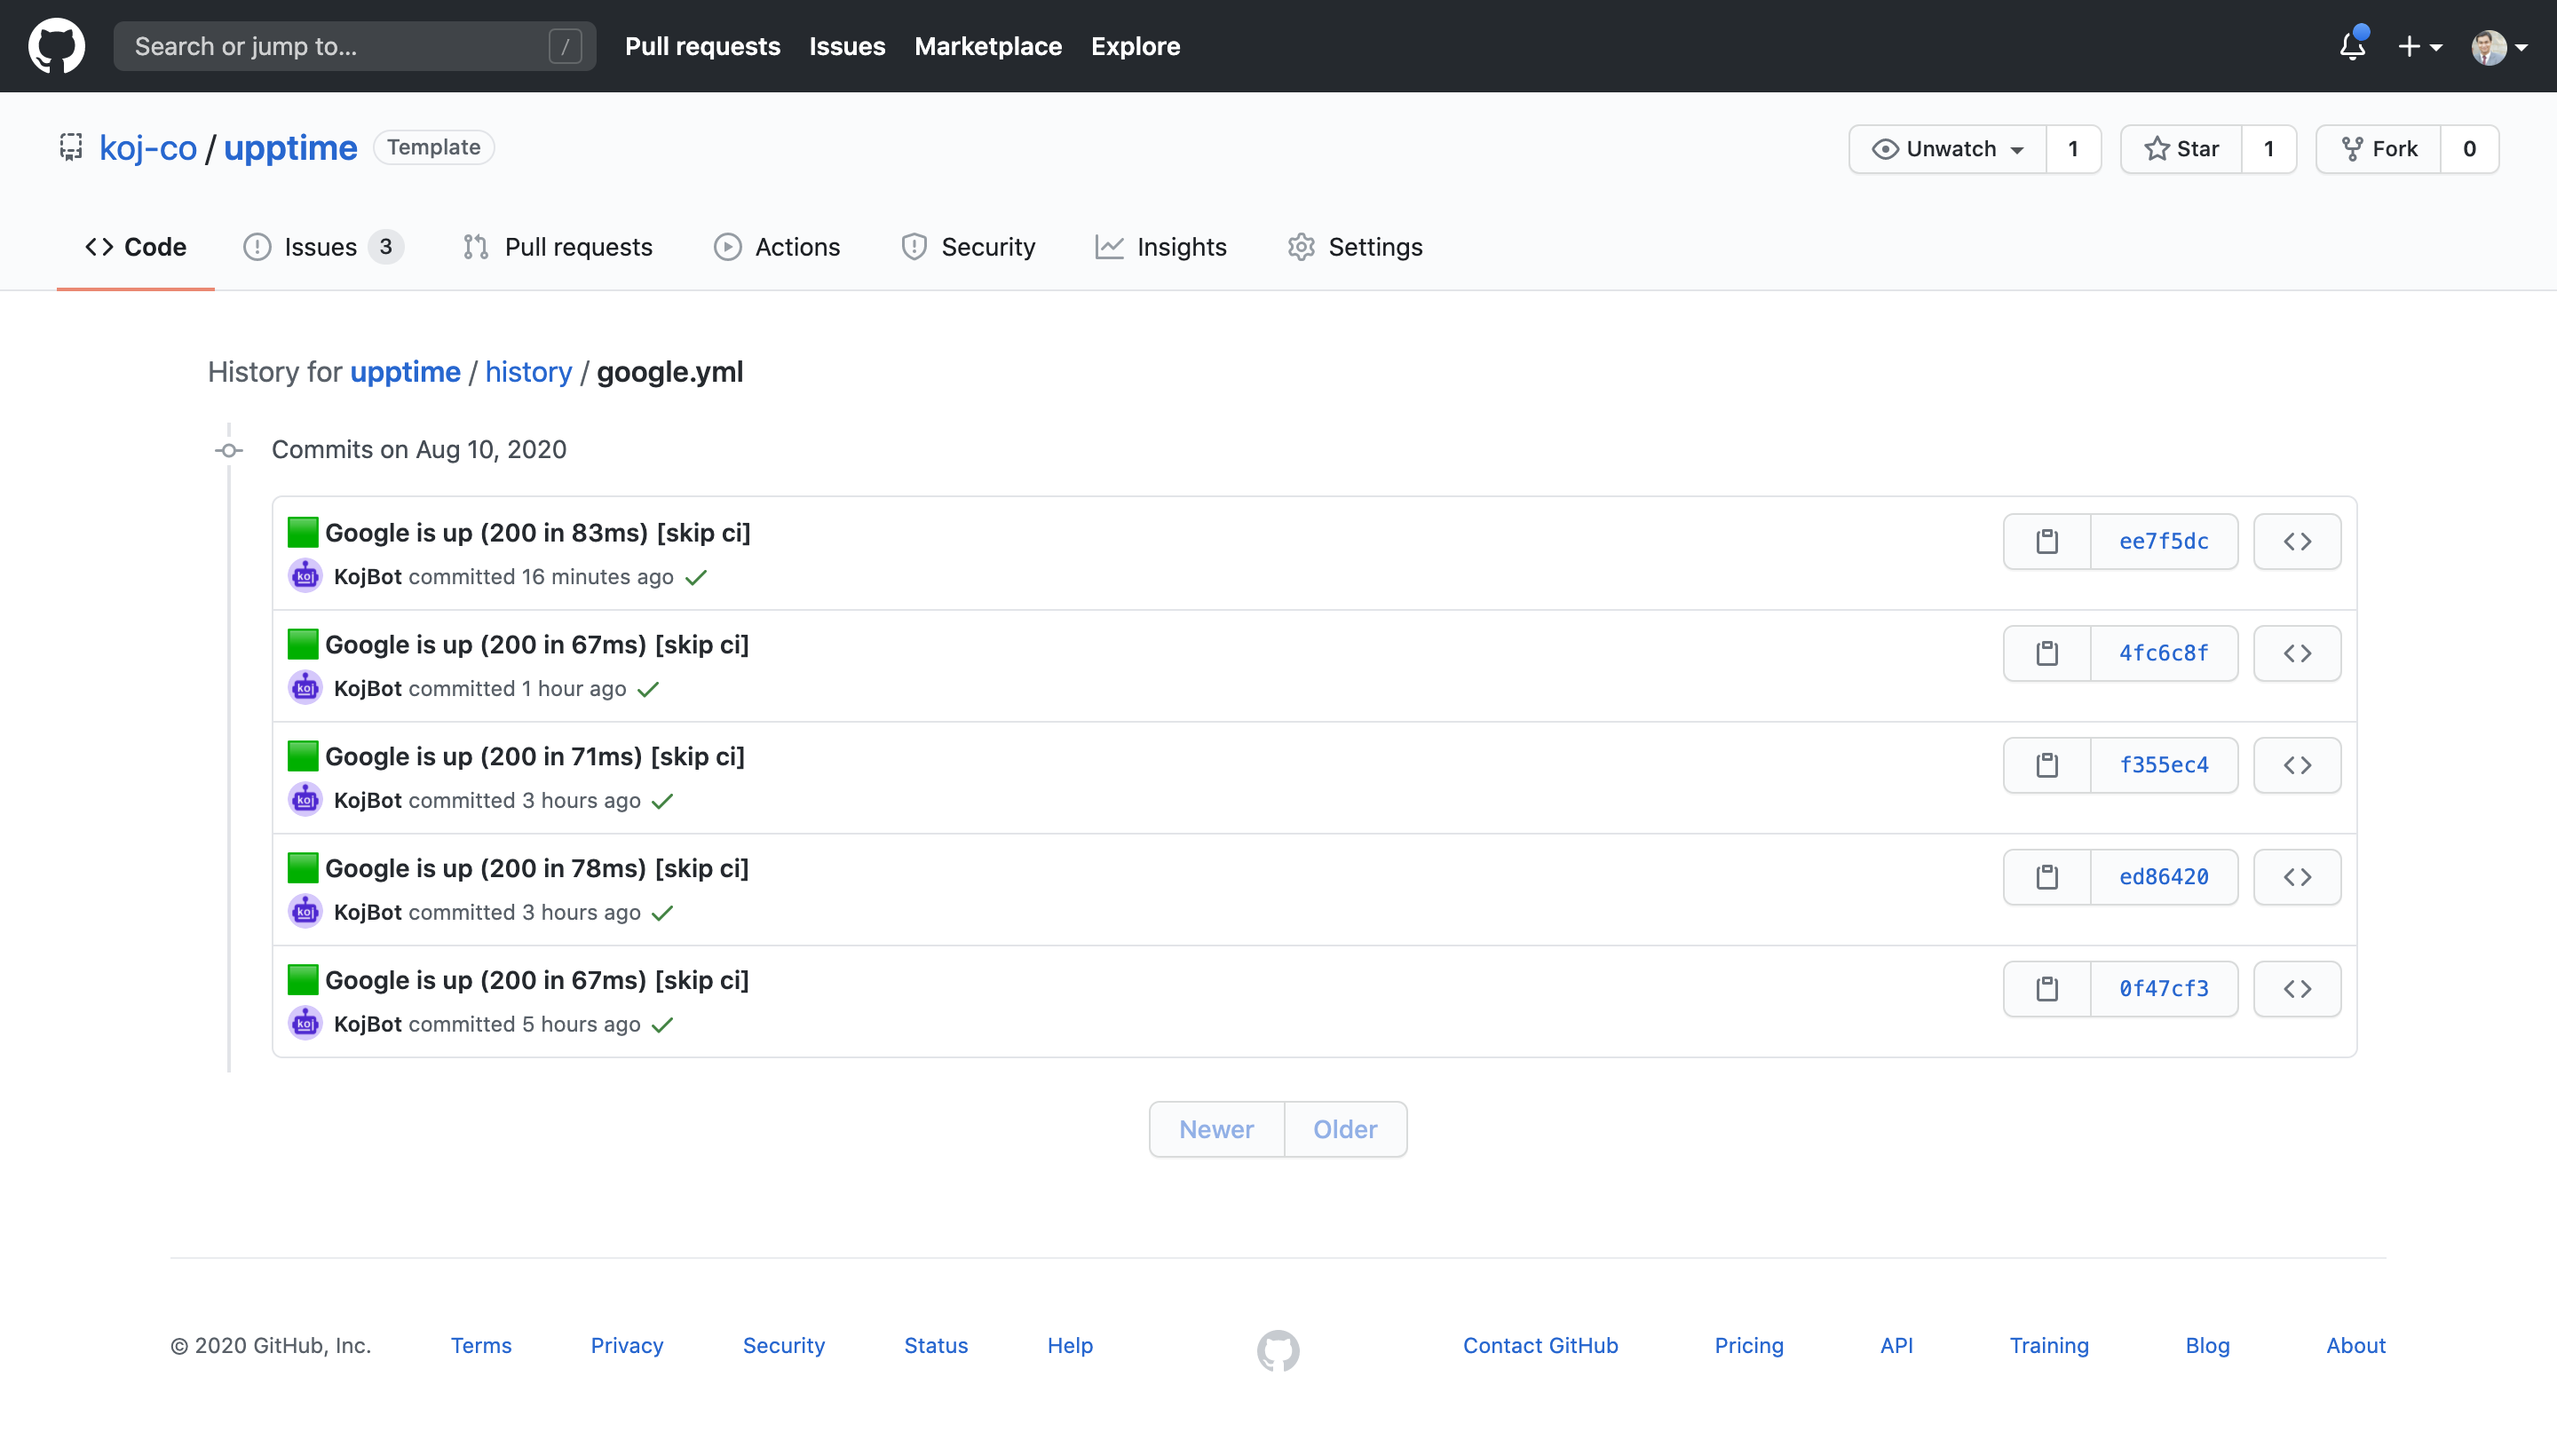
Commits for response time
Four times per day, another workflow runs and records the response time of your websites. This data is committed to GitHub, so it’s available in the commit history of each file (example commit history). Then, the GitHub API is used to graph the response time history of each endpoint and to track when a site went down.
|
|
📄 License
- Code: MIT © Anand Chowdhary, supported by Pabio
- Data in the
./historydirectory: Open Database License